
FIELD DATA YOU CAN ACT ON
TW DATA HUB
India's field-deployed environmental data network for real-time decisions and historical insight.
India's field-deployed environmental data network for real-time decisions and historical insight.
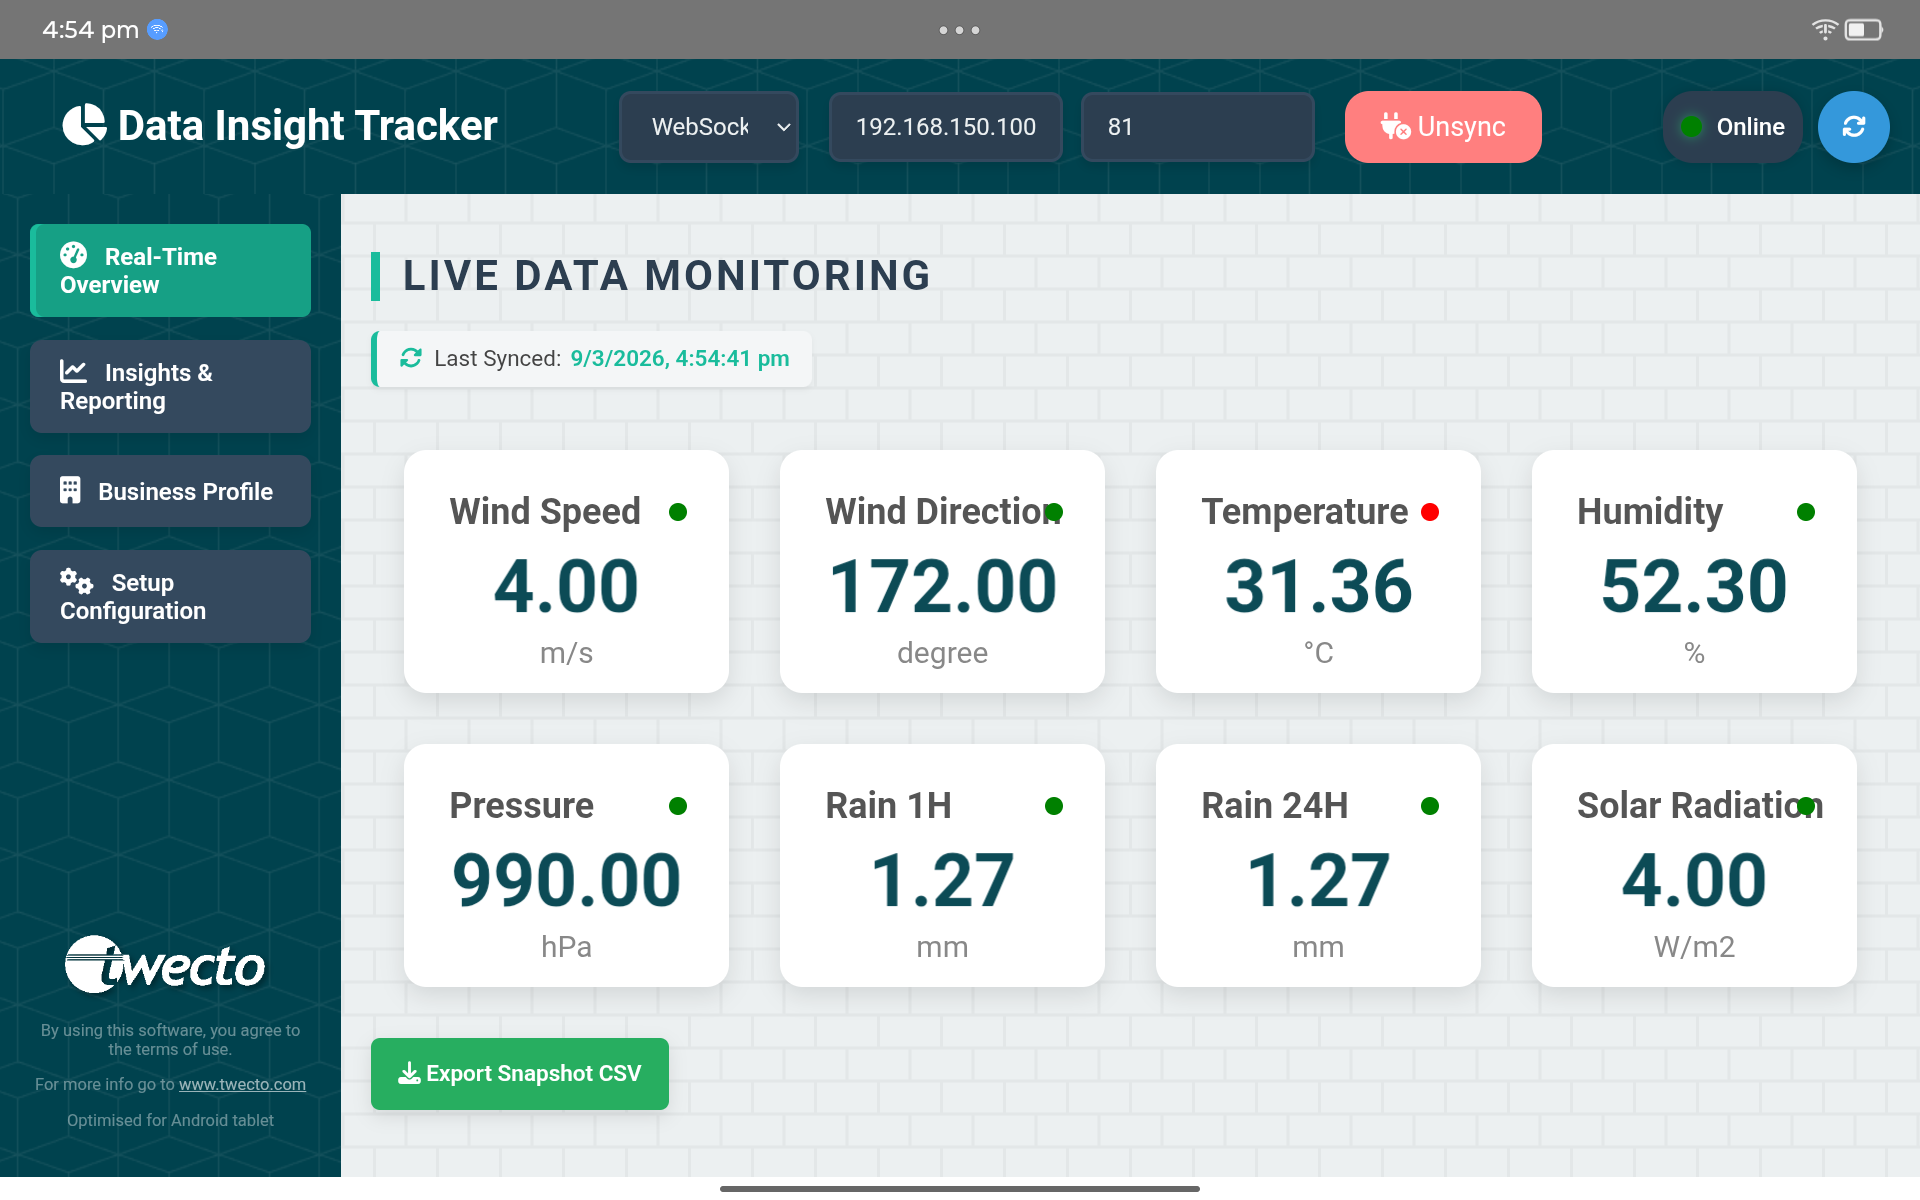
Monitor live conditions through a focused dashboard built for field teams, researchers, and operations managers. Track key parameters, check connection status, and export snapshots when you need them.
Readings collected from instruments operating in real conditions across India.
Structured data prepared for dependable analysis, reporting, and comparison.
Use archived readings to understand trends, events, and seasonal patterns.
Choose downloads, reports, or API access based on how your team works.
Choose the data access tier that fits your use case — from one-time downloads to live API streams.
Access cleaned, QC-checked historical and near-real-time sensor readings in CSV or Excel format. Select by location, parameter, and date range.
Receive expert-curated monthly or seasonal PDF reports with trend analysis, anomaly flags, regional comparisons, and executive summaries.
Integrate Twecto's sensor network directly into your application via a secure REST API. Real-time JSON feed with programmable query filters.
Environmental data from every parameter measured by our field-deployed stations — weather, hydrology, water quality, air quality, and soil data — available for purchase.
Comprehensive atmospheric parameters from our automatic weather stations.
Water resource and groundwater data across river basins and aquifers.
Root-zone and canopy data to support precision agriculture decisions.
Ambient pollution and particulate data from industrial and urban zones.
Our real-time and historical environmental data from India is trusted by researchers, government agencies, agri-tech companies, and climate startups who need accurate, ground-truth field data.
Verify weather event claims (drought, excess rain, cold wave) against ground-sensor data — not satellite estimates.
NDMA, SDMA, and state flood cells use our real-time feeds for early warning triggers and post-event analysis.
Universities, IITs, and CSIR labs use our multi-year archives for climate modelling, thesis research, and publications.
Power your advisory app or crop calendar with hyper-local, field-level data instead of interpolated forecasts.
Urban heat island studies, drainage design, and green-building compliance require verified microclimatic data.
State irrigation departments and groundwater boards track aquifer behaviour and monsoon recharge using our sensor feeds.
Active deployments spanning major agricultural, industrial, and river-basin zones
A snapshot of how our data looks — recent hourly readings from active field stations.
| Timestamp (IST) | Station ID | Location | Temp (°C) | Humidity (%) | Rainfall (mm) | Wind (km/h) | GW Level (m) | Status |
|---|---|---|---|---|---|---|---|---|
| 2026-09-21 08:00 | TW-UP-0041 | Aligarh, UP | 27.8 | 71 | 0.0 | 10.8 | 4.79 | Sample |
| 2026-09-21 07:00 | TW-UP-0041 | Aligarh, UP | 26.4 | 76 | 0.0 | 8.6 | 4.79 | Sample |
| 2026-09-20 18:00 | TW-RJ-0022 | Jaipur, RJ | 32.6 | 48 | 0.0 | 16.2 | 7.08 | Sample |
| 2026-09-20 12:00 | TW-MH-0078 | Nagpur, MH | 31.8 | 63 | 4.8 | 14.7 | 3.56 | Sample |
| 2026-09-20 06:00 | TW-PB-0015 | Ludhiana, PB | 23.9 | 82 | 1.6 | 6.8 | 6.11 | Sample |
* Sample data shown for illustration. Actual datasets include additional parameters and QC flags.
Tell us what you need and our team will recommend the right dataset, format, and access plan.
Select weather, hydrology, agriculture, air quality, or a custom combination.
Tell us the location, date range, parameters, and preferred delivery format.
Our data team will respond with availability, sample files, pricing, and next steps.
Talk to our data team to get a custom quote, access a free sample dataset, or integrate our API into your platform.
Get a Free Sample WhatsApp Us